Acquire, store, visualize and export telemetry of Internet-connected devices.
The telemetry cloud system to manage the data of any kind of device, including IoT devices and sensors.
Features
- Acquisition and storage of telemetry data
- Display and export of data on charts, maps and user-provided plans
- Real-time visualization tracking
- Management of devices, sensors and data channels through web application and API
- Email notifications on threshold exceeding
- Collaboration with team members
- Management of users and permissions
- Secure and reliable cloud infrastructure
- Ready to use without any software installation
How to use it
- Make a subscription
- Insert your devices, sensors and channels using the web interface (or the provided API)
- Copy the telemetry address and token in your devices
- Send telemetry as a simple JSON object
- Enjoy your data!
Learn more »
or
Create a free account »
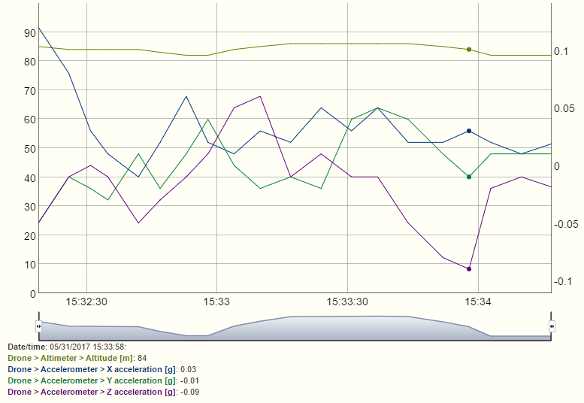
Static and real-time charts
Show telemetry on static charts along with graphical indicators, take a screenshot, download data you are looking at or follow what's going on in real-time.
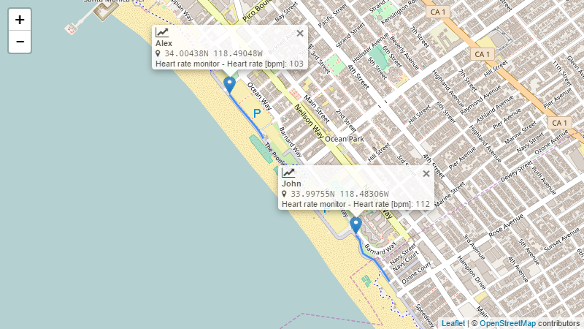
Maps with tracking
Explore telemetry of your stationary devices or moving assets on a geographical map in real-time.
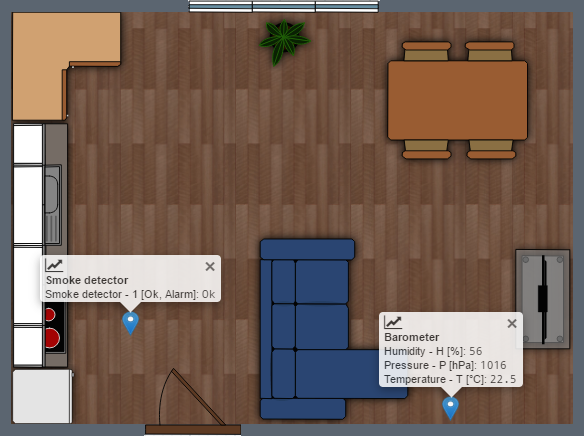
User-provided custom plans
See your devices on your own plans or pictures of your building, your garden or your room. Your IoT infrastructure at a glance!
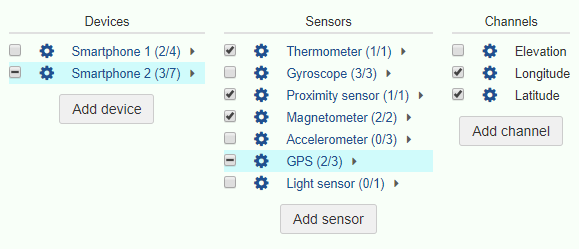
Easy devices management
Set up your devices along with their sensors and data channels arranged in a hierarchical layout.
Suitable for any kind of device
If your device can create simple JSON data objects and send them using HTTPS then it is ready to join Sensorbis.
There is no other software or hardware requirement and data can be transmitted using any technology.
Management API
All the management can be done using the web application. But when automation is needed to manage devices, sensors and channels, a simple and fully documented API can be used.
Email alert on threshold exceeding
You can configure a threshold for each data channel of your devices and receive an email when the threshold is exceeded.
A configurable interval prevents email notifications to be delivered too frequently.
Personalized subscription
You can define all the parameters of your subscription: the duration, the maximum amount of hourly telemetry data, the duration of detailed and aggregated data retention, the maximum number of users and the limit of daily threshold alerts.
Advanced charts visualization
You can choose which channels to show and you can also split data on one chart per device, per sensor or per measurement unit.
Static charts offer the flexibility to choose data grouping interval and modality (averaged or summed).
Data export
Data can be exported from a static chart as an image, a CSV file or a HTML file.
The exported data keeps the chart data grouping.
Users collaboration
You can grant access to other users and assign their suitable permissions.
You can also invite non-users to subscribe and join your federation.
Security
Users interactions, API calls and telemetry sending use HTTPS and are secured with strong encryption tokens.